Gold vs the 10yr Treasury Stupid charts (wink) Target achieved. Now what?
 RedneckHB
Posts: 19,860 ✭✭✭✭✭
RedneckHB
Posts: 19,860 ✭✭✭✭✭
Decided to start a new topic so I can find easier in the future.
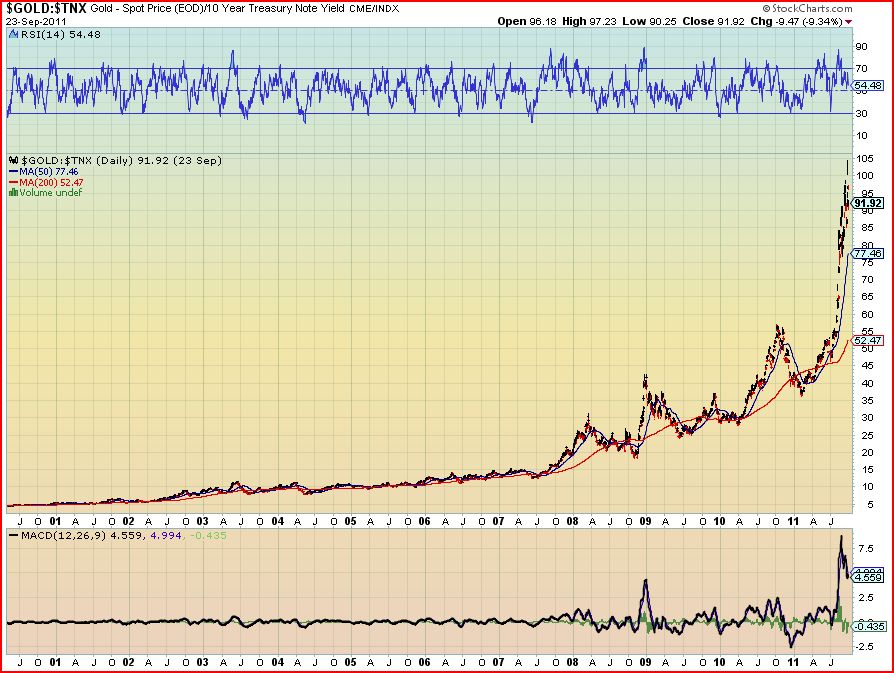
So I've got some free time today--accounts in greenbacks and I have no interest in playing emotional markets, so I thought I would play around with some charts. And this one appears to be the most dramatic. Its a comparison chart of the price of gold vs the US 10-yr interest rate. Now obviously gold has gone up and interest rates down, but now the chart appears to have reached a critical point. Parabolic would be an understatement so I see a reversal of some sort occuring. Either 10yr rates go up or gold goes down. What would cause such an "unwind" to occur and what would be its economic implications? How would you play it?
So I've got some free time today--accounts in greenbacks
Excuses are tools of the ignorant
Knowledge is the enemy of fear
0
Comments
That's a fascinating ratio.
Perhaps more interesting than the recent peak is the comparative stability during 1991 - 2002 or so. The high over the low for this entire 10-year plus period is about 1.75. After that, there are multiple 6 - 12 month periods where the high/low exceeds 1.75, often significantly. In all cases there is a significant "correction". Without thinking about the fundamentals, it seems like a good bet that this ratio will fall below about 70 within six months! (but caveat to all partcipants -- don't rely on my track record when it comes to making wild guesses
In terms of mid-term mechanisms, even a relatively modest increase in interest rates might send gold lower for a few obvious reasons: (a) it is costlier to hold, and (b) it would be a minor signal of some semblance of normalcy in the markets.
In any case, it seems likely that the ratio will remain volatile for quite some time.
You wrote.......
Gold doesn't have to attain any particular price, so I would consider it a dumb number, a constant if you will. If you consider the underlying data the chart is unsustainable because interest rates must eventually reflect some market risk - one way or the other. The yield curve simply can't stay flat or have a negative slope forever, because of people's expectations about the future. Eventually a risk premium will develop at the long end of the yield curve, and that will show up in the 10-yr rate as well. That's under "normal" conditions.
What we have here, is a sovereign default environment. Think Russia, 1989. Lots of things can happen from here on. I don't think that all of them can be predicted, nor would I ever expect that the progression of events would be orderly. Lots of people don't even know what fiat currency is, but they put all of their faith in it. I don't.
Knowledge is the enemy of fear
I knew it would happen.
Yeah, it is an interesting chart and one im not sure how to interpret. It may very well mean nothing, but given the importance and, in a sense, interdependence of each, I think there is something here. Obviously we are at an extreme and I cant quite figure it out. It will probably come to me when im moving the lawn.
Is it that possible that real interest rates will rise? Since I cant see nominal rates rising with the FED purchases, perhaps we have finally crossed the line, into deflation.
I was sort of joking with my local coin dealer buddy at our coin club last Monday telling him that I could see silver going red by the end of the year. He trades quite a bit and is well versed in the markets and agreed that prices were probably going to fall but not take out the Dec 31 close. I never thought that price would be hit in the next 10 days. Incredible.
Now I am wondering if gold will take out its Dec 31 close. It has been 11 years since a yearly close lower and would require about a 38% drop from the highs to do so. A price drop of this magnitude seems extreme, but I dont think it is out of the realm of possibilty.
Knowledge is the enemy of fear
<< <i>Now I am wondering if gold will take out its Dec 31 close. It has been 11 years since a yearly close lower and would require about a 38% drop from the highs to do so. A price drop of this magnitude seems extreme, but I dont think it is out of the realm of possibilty. >>
I highly doubt it. The debt counsel will fail at the end of the year and there will be several debt crisis spooks. Eventually, we'll need to raise the debt ceiling yet again. The next week or two will look like great buying opportunities for gold/silver as we look back months ahead. The margin hikes were pure manipulation. A year from now gold $2K/oz and silver $50/oz. None of our underlying debt problems are being addressed. -APP
Where are you moving it to?
Regarding the chart, would it be more meaningful if you compared ratio of the gold spot price to the price of a 10-year Treasury vs. the dollar index? Or perhaps the price of the dollar vs. a precious metals index over the same period?
I would compare prices vs. prices, rather than comparing a price to a yield.
I knew it would happen.
<< <i>
Now I am wondering if gold will take out its Dec 31 close. It has been 11 years since a yearly close lower and would require about a 38% drop from the highs to do so. A price drop of this magnitude seems extreme, but I dont think it is out of the realm of possibilty. >>
nothing is out of reason. it would be a big signal though to have gold lose it's luster. it just seems that even if that happens, nothing is really repaired, fixed, getting better in economies around the world.
maybe gold = commodity is the better equation for now?
let us know if anything comes to mind during the lawn mowing....
The items being compared are in a way, opposite from each other. In other words, whenever individuals cannot get much interest from treasuries, they look for other areas; investment in gold tends to go up because more will buy it. And of course, when you do a ratio between these two, of course it is going to look parabolic. The lower the interest rates go, the more demand for gold and the higher the price.
What will it take for this to return to 'historic' norms for the ratio? Well, to start, less interference from the government and the fed in pushing interest rates to an unrealistic low number. That is the reason for the abnormal rise in the graph. Let interest rates establish themselves as per the market, and I'm sure the graph will show a much more 'normal' pattern.
IMO, the graph does not indicate to me that the price of gold is overpriced, or in a bubble, in case that is what anyone else may be inferring.
In other words... when free markets are established, perhaps there is an equilibrium between the price of gold and the treasuries interest rate. The economy is much more stable, some demand for gold is there but when demand for treasuries go down, the interest rate goes up to bring more purchases in. So it self regulates.
But then when the government steps in, 'twists' the money around, does QE to the nth power, artificially places interest rates way below where they should be per demand, etc. the things become abnormal. That is what we are seeing. Huge government interference in the markets. BTW, by artificially pushing interest rates very low, isn't that a form of price controls? I have always thought price controls in the market do not work; I remember the oil embargo days and Jimmy Carter all too well.
this
“We are only their care-takers,” he posed, “if we take good care of them, then centuries from now they may still be here … ”
Todd - BHNC #242
Similarly, maybe in the past gold was $500 and the 10y note yielded 5%, seems that 500/5 should be 100, not something in the single digits.
I also tried $1800/102 and the magnitude is still wrong. What am i missing?
Liberty: Parent of Science & Industry
<< <i>Perhaps one thing this graph might be showing... is the amount of government 'interference' in the market.
All I had to read was the first sentence.
As of late, lots of "business" money on the sidelines. Clarity comes in 13+ months.
<< <i>I guess I don't understand the Y axis. If gold is, say $1800, and the 10 year note yields, say, 2% (or .02), why isn't the number on the right 900 (or 90000)?
Similarly, maybe in the past gold was $500 and the 10y note yielded 5%, seems that 500/5 should be 100, not something in the single digits.
I also tried $1800/102 and the magnitude is still wrong. What am i missing? >>
Maybe this helps. The above chart is simply the ratio of the 2 following charts--gold and 10yr yields. Their movement in opposite directions is shown in the OP chart, which I believe is in the late stages of a parabolic move. Instead of using 5 to represent 5%, use 50. For example, look at 1996. Gold was 417 and rates were 5.5% (55), giving at ratio of about 7.5%, which is shown in the OP chart.
For this parabola to end, the trend of one or the other must change dramatically, or both change somewhat more than slowly, but change nonetheless. If both move sideways, that would keep this ratio at the top of the parabola, which is something I've never seen before, so I believe that is unlikely.
To update to include Friday's activity.......This ratio hit a high of 104 on Thursday and closed at 91 on Friday. Obviously we saw gold move down and rates rise, so maybe this unwind started yesterday. One thing I do want to note and others will corroborate, when a parabola breaks, it usually loses at least 70% of it value. And with what looks like potential support near 36, this is probably where this ratio is headed. Anybody feel like running the math to compute possible values of the POG and interest rates to achieve a value of 36?
Like I mentioned earlier, this chart may mean nothing. But as a student of technical analysis and economics, to me, this chart is fascinating.
IMO, the graph does not indicate to me that the price of gold is overpriced, or in a bubble, in case that is what anyone else may be inferring.
My interpretation would be that either gold or 10yr bond are in a bubble, or perhaps both. Also valid comments on govt intervention and unintended consequences.
Knowledge is the enemy of fear
I find it fascinating that your ratio has four distinct peaks after 2008 (plus the current one) , while the reciprocal of the treasuries has just two; gold has less obvious peaks during the period - after its fall at the start of 2008 its path is almost straight up, though minor peaks get amplified when you divide by the interest rate. If someone really wants to have fun, they should play with this sequence from the perspective of Shannon Information ...
With regard to returning to a ratio fo 36, here are a few possible combinations:
        GOLD                         10-Year

        3000                          8.33
        2500                          6.94
        2000                          5.56
        1500                          4.17
        1000                          2.78
          500                          1.39
I suppose there are at least two ways to think about this. If you believe that gold is plausibly priced (or undervalued) at present, markets should force interest rates up in spite of central bankers' intentions. On the other hand, if we are in a long term deflationary situation, and interest rates will stay low, then we might see gold coming back to around $ 1000.
(and if inflation really flies out of control, expect high interest rates and $ 3000 + gold!)
This seems to give a somewhat exagerated appearance to the trajectory of price in relation to time.
You got me on that one. I looked it up and still dont understand.
I like your numbers and will be very interesting to see if this chart palys out. With central banks around the globe either buying debt or lowering rates, I thinks its going to be very hard for rates to go higher in the next few years. And if deflationary pressures take hold, rates could even go much lower than present.
The ratio is down to 86 at time of writing.
Knowledge is the enemy of fear
The ratio is down to 86 at time of writing.
and headed towards 65?
Liberty: Parent of Science & Industry
The ratio simply reflects the relative success of the manipulations.
<< <i>IMO the price of gold and the yield on the 10-year Treasury are both manipulated.
The ratio simply reflects the relative success of the manipulations. >>
You may very well be right. Im just looking at the chart as a "manipulation" that is going to be unwound.
Knowledge is the enemy of fear
As is often the case, finance people find amazing applications for math and science that was originally developed without a finance application in mind! In the case of Shannon information, (though I would definitely be putting on airs if I claimed more than a novice's understanding), Wall Street and risk management quants are working on techniques that take as input some time dependent sequence of numbers, and try to determine the extent to which the numbers are random, and the extent to which behavior at one time is correlated with behavior at prior times. Though this can in theory be done to some extent with standard statistical analysis, Shannon's theory of information seems to be well suited to the task.
As regards your very interesting sequence, by just eye-balling the numbers, it is hard to say whether the various peaks and valleys are substantially random, or whether there are interesting trends lurking in the data. Obviously the long term trend has been "up", but using information theory techniques, you might be able to get some insight into whether the upward trend is tied to fundamental factors influencing the results, or whether it is more a matter of "momentum" so that it is the "results are affecting the results." I don't know to what extent it is really being used by traders, but the goal would be to assess whether or not there is likely to be a sudden discontinuity.
In any case, this sequence numbers would be fun to play with!
I think there is a decent chance that the 10yr hits 3%-3.3% over the next few quarters, maybe months. See chart below. A yield of 3.3% and a gold price of 1250 would put the ratio at about 38. Interesting, eh? Or a 50% retrace of the upmove since 2003--$1150--combined with a 3% yield also gets the ratio to 38.
Also is the current gold chart with Fibonacci retracement levels. These levels can be quite arbitrary as sometimes the beginning and end of trends are not well defined. But I choose this time frame as the retracement levels line up quite well obvious price support levels.
Knowledge is the enemy of fear
1) The U.S. curtails its printing of money. The newly restricted supply of money, coupled with stable or increasing demand, forces the cost of loans (interest rates) upward, including interest rates on the 10-yr treasuries. The resulting combination of higher nominal yields and lowered inflationary expectations would be bearish for gold.
2) The U.S. increases the money supply at an accelerating rate. The resulting inflation and fears of higher future inflation make people less willing to hold cash and low-yielding monetary assets such as 10-yr treasuries. The combination of an expanding supply of money and a lower demand for near-cash assets forces interest rates upward. This scenario (more likely IMO) would be bullish for gold.
Given today's increasing economic uncertainty, I doubt that a 3.3% interest rate would induce many people to exchange their gold for 10-yr treasuries.
Thats not the point, nor do I suggest that happening.
The gold trade has been fueled by cheap money, ie, 10yr rates under 2%. As rates rise, that cheap money--read fast money--will leave. People wont exchange gold for a 3% yield, but rather will unwind positions. Remember, gold needs capital appreciation to make this trade profitable as it doesnt pay dividends. It provides no cash flow. If it appears the trade will flatten out, then money will quickly leave gold as the cost to carry it becomes more expensive.
Knowledge is the enemy of fear
Liberty: Parent of Science & Industry
<< <i>So, gold went up because it kept going up, and once it starts going down, it's likely to keep going down? >>
While you know I subscribe to the KISS principle, it isnt quite that simple. But there is a lot of truth to the saying, "buying begets buying".
While there is a group of investors who buy gold because "the end is coming", "inflation is out of control", "repeal the FED", ect, there is another group--probably much larger--that simple buy assets because they believe "the trend is your friend".
Also regarding buying from the Chinese and Indians---the best cure for high prices is high prices. Gold prices now represents a HUGE % of their income. While they may not stop buying, they will certainly buy less. Even if the same number of people want to buy, then can only afford less. This is classic demand destruction in the face of "apparent increasing demand".
Knowledge is the enemy of fear
<< <i>I don't hold any long or intermediate term treasuries, gold could dip precipitously but the bull hasn't run it's course and it will be back. >>
I believe the opposite. The Gold Bear has been in hibernation and it's stirring... getting hungry.
The Silver Bear has been feeding since the middle of last year and appears to be still hungry.
If it appears that the currency is depreciating faster than the interest rate is increasing, then money will likely not quickly leave gold. In that situation, the price of gold and other hard assets (in depreciating dollars) may continue to rise even as *nominal* interest rates rise along with it. Post a chart from 1979 (a year of 13.3% inflation, according to official statistics) and you'll see an example of this scenario in action.
Im just showing the charts. Charts that show a rather dramatic corrolation. Read them the way you want.
You seem to think that I am saying the gold bull is dead. I've never said that. Just simply that the "store of value" could easily lose 38% of its value. Even MF Global customers didnt lose that much.
This 11 yr run is long in the tooth and needs to consolidate. Nothing wrong will gold at $1500 in 2014, is there? Unless you bought it 20% higher--like many did, and sat with a loss for 3 years--like many will.
Knowledge is the enemy of fear
If you understand what is coming, then you can duck. If not, then you get sucker-punched. - Martin Armstrong
Knowledge is the enemy of fear
I have a person I've sold a very hefty weight of 90% over the last couple yrs. He's a bit strange. Lives out on the Forest edge in a Cabin he built. Tells me he still believes silver will go up as oil is depleted. Supposedly somehow places the silver somewhere under the Cabin and the solar radiant heat is useful. He's actually an engineer of some type with a wife that's a Doctor. He's had the funds to stockpile apprently quite a pile.
I don't have a service to pull custom charts. Can anyone humor me with a Gold/oil chart ? Wondering how loony he is. Might not be so relevant with all the new Domestic oil production.
Thanks
I WOULD BE VERY INTERESTED IN THAT CHART! Anyone?
and
Last 10 years Gold vs Oil vs Dollar, for example
also
bubbly bubbly bubbly
Liberty: Parent of Science & Industry
Liberty: Parent of Science & Industry
Knowledge is the enemy of fear
<< <i>Fiat? They bought Ferrari (and Chrysler.) If they're using Ferrari as currency then sign me up. However, if they start using Chrysler... >>
I forgot the quote thingy so the above prolly means nothing unless you go back to page 1.
I postulated that there was a strong corrolation between gold and the yield on the 10yr Treasury. This was fairly evident given the parabolic nature of the chart. I predicted that the ratio could get as low as 36 and I still think thats possible, while most probable range is 36-42.
a 50% retrace of the upmove since 2003--$1150--combined with a 3% yield also gets the ratio to 38.
Damn stupid charts cant predict the future.
Best to read the entire thread. What next for this ratio and the components (gold and 10yr yields)?
Knowledge is the enemy of fear
There is some very interesting technical action in the 10 yr yield today, which broke to new yearly lows, after a gap opening. the 10 year yield is not behaving like a lot of people who were sure yields were going higher this year, thought. Conventional wisdom rearing head once again.
Knowledge is the enemy of fear
Fascinating thread. Great commentary Higashiyama.
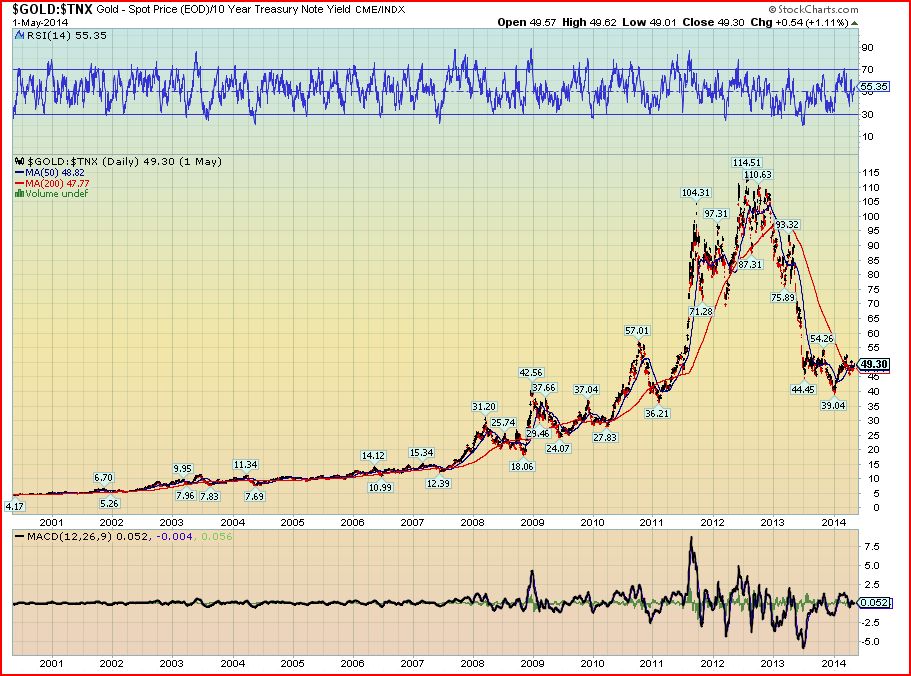
This ratio has been finding support around 40 for the last 5 years. Pretty much as predicted 7 years ago.
Knowledge is the enemy of fear