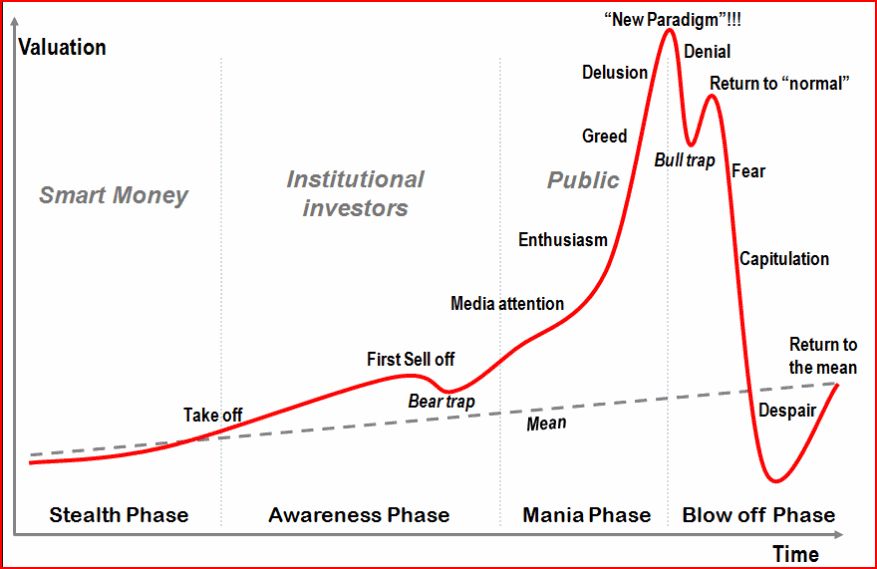
Remember the thread that posted a chart of typical bubble patterns?
 RedneckHB
Posts: 19,947 ✭✭✭✭✭
Interesting how psychology seems to trump fundamentals and the like.


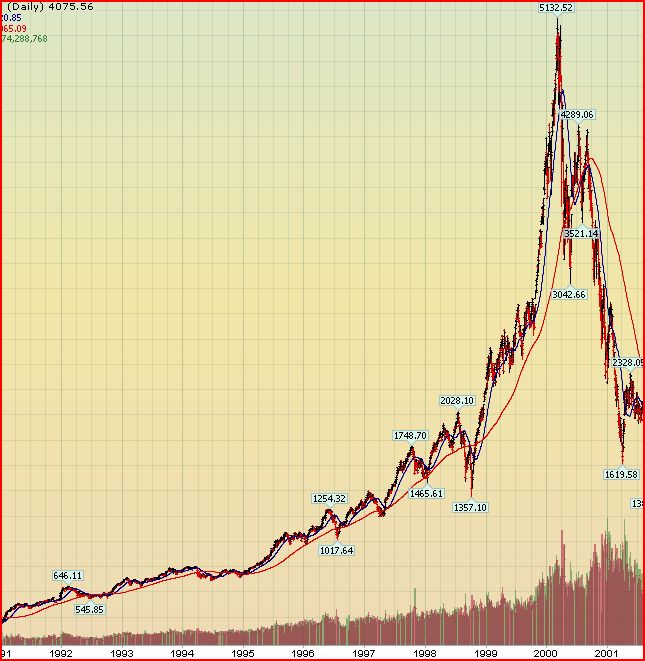
Nasdaq

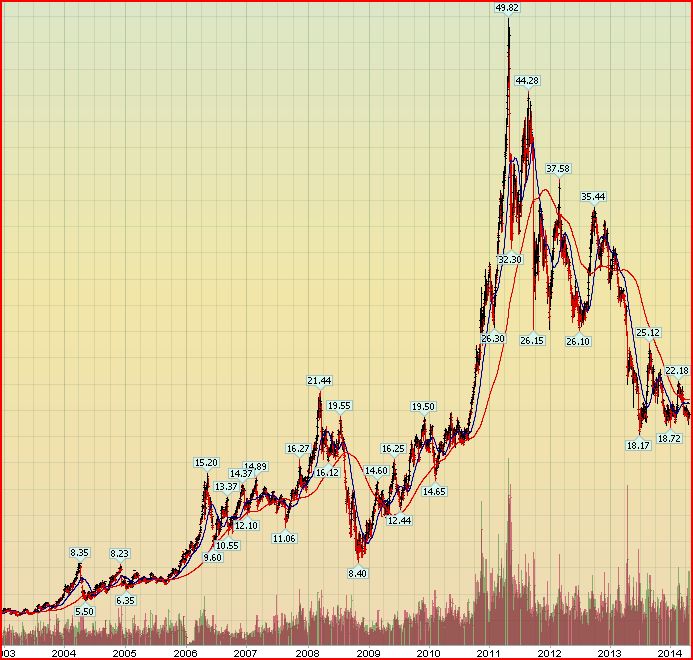
Silver

Prices to have a tendency to trend higher again....over time. I would say silver has pretty good support at 18-19, then 15 then 10. I dont think 10 is likely.


Nasdaq

Silver

Prices to have a tendency to trend higher again....over time. I would say silver has pretty good support at 18-19, then 15 then 10. I dont think 10 is likely.
Excuses are tools of the ignorant
Knowledge is the enemy of fear
0
Comments
If two brothers can squeeze silver to $50, imagine what a world of stackers is about to do.
<< <i>"sell Mortimer, sell" >>
About 3 years late.
<< <i>We might be back in the "Mania Phase" by next year! >>
Bubbles never re-inflate quickly, and usually a decade or more (a generation) passes before previous highs are eclipsed. But a rally in silver back to 35 is still a 70% return from here. That aint too shabby, unless you are a member of the "public" participants, in which case you get your money back.
Knowledge is the enemy of fear
<< <i>We might be back in the "Mania Phase" by next year!
I don't see that happening. It appears we are still stuck in the Despair stage.
yep, pretty easy to see short term support at 18 and resistance at 22. Longer term support and resistance levels might be like 13 and 26.
Looking at that chart, it really didn't spend much time above 40, did it? I'll bet if silver hit 30 again there would be massive selling.
Liberty: Parent of Science & Industry
<< <i>Silver appears to be enjoying an extended capitulation, likely because some faithful are still in the new paradigm and denial stages and keep on stackin, keeping us from despair at 15 or lower
yep, pretty easy to see short term support at 18 and resistance at 22. Longer term support and resistance levels might be like 13 and 26.
Looking at that chart, it really didn't spend much time above 40, did it? I'll bet if silver hit 30 again there would be massive selling. >>
I bet there would be massive buying too and then a lot of grumbling
I knew it would happen.
Knowledge is the enemy of fear
Knowledge is the enemy of fear
look at 2006 vs 2009, same general shape but different magnitude, and then subsequent, they performed very differently later because of sales growth and market leadership
chart
Liberty: Parent of Science & Industry
Knowledge is the enemy of fear
I have to take the context into account to make sense of it. Some are bubbles, but some look like bubbles but end up being an industry being born, for example, and going through a couple of gyrations.
Liberty: Parent of Science & Industry
<< <i>if it's a sector (or country) with a future, I'd buy that to ride to 20. >>
Does the USA have a future? The chart is the DOW priced in ounces of gold.
Knowledge is the enemy of fear
<< <i>
<< <i>if it's a sector (or country) with a future, I'd buy that to ride to 20. >>
Does the USA have a future? The chart is the DOW priced in ounces of gold.
which captures a very nice example of a secular waveform in offsetting asset classes, a couple of bubbles and crashes illustrate a very interesting phenomenon.
draw a best fit line, and trade around that in opportunistic swings?
Liberty: Parent of Science & Industry
<< <i>a long gold/short DOW play seems entirely reasonable at these levels, although i'd do Ag instead.. >>
You seem to have contradicted yourself, or do you feel the USA do not have a future? It the chart works its way back to 20 as you thought it might, then that means stocks will outperform gold.
Knowledge is the enemy of fear