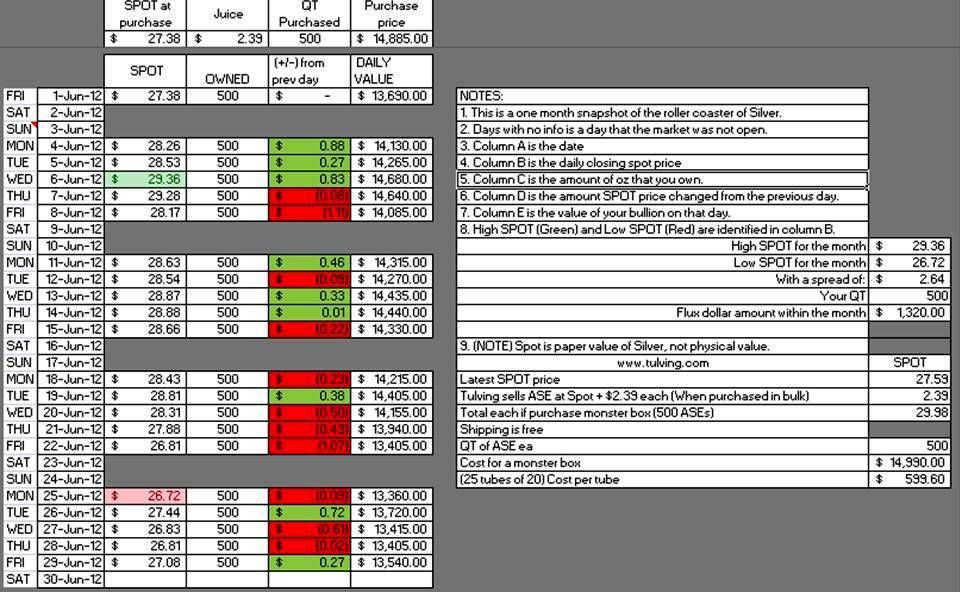
500 oz of Silver, the JUN 12 rollercoaster.
Okay, so here is the chart that I just put together. It's pretty much self explanatory, the box that I wanted to focus on is J18 where it shows how much the 500oz investment would have fluctuated this month.

Feel free to ask any questions.
Ray

Feel free to ask any questions.
Ray
0
Comments
I knew it would happen.
No Way Out: Stimulus and Money Printing Are the Only Path Left
With that said, I look at it month to month.
I wanted to put something together to show them how much of a roller coaster they will be on. I guess I could use the same format but plug in monthly or weekly numbers to give a wider view.
Thanks for your input,
Ray
The high and low identified in column B are done automatically.
I used 500 because that is the amount in a monster box but I guess any amount could be used.
I did have to manually fix the formulas for the (+/-) prev days, otherwise all the other math is done automatically with formulas.
I used tulving because I am told they are the cheapest when buying in bulk.
On the right, the high and low spot are automatically found and brought over. The rest of the info on the right is all automatically updated.
Yes, I enjoy making trackers...lol.
One use I like about computers (coming from a pencil & pad guy, yeah, we still exist)
I knew it would happen.
<< <i>day to day monitoring is not healthy for the PM investor. Try year to year.
That is true. Tough to lose 1/2 your money in a day, but not so in a year.
Maybe silver made a successful test of support this past week. Lets keep our fingers crossed.
Knowledge is the enemy of fear
The difference of the highest spot value for the month, to the lowest for the month is 1,320. ... which is about 9.4% from the simple average of those two high/low points
The "swing" therefore could be construed as 1/2 of that, or +/- 4.7%
Using the June 1 spot price, the highest spot gain was 3 trading days later (+7.2%), and the greatest spot loss was 16 trading days later (-2.4%)
For the month, spot lost 1.1%
Additionally, the simple average closing price for the month (21 trading days), was 14,040., which is actually almost 2.6% higher than the June 1 close
Having been in the Stock Market for close to a couple decades, I hardly find the month of June to be too "roller coaster" worthy when compared to individual security issues I have seen, owned and tracked, but certainly is not mundane either.
Also, while the ASE's in your example were purchased at a premium, they are almost always sold at one as well, so I just used spot as the price. Obviously, buying and selling at the same premium is probably not feasible for most, and doing so at any type of advantage is rarer still, but again ... they are typically sold at a premium even at wholesale prices.
Finally, as has already been stated, watching daily prices is kinda crazy, and can sure feel like a sickeneing roller coaster. I only watch daily's close when I am planning an immenent buy or sell.
“We are only their care-takers,” he posed, “if we take good care of them, then centuries from now they may still be here … ”
Todd - BHNC #242
However, unless they can handle a ride like that they need to find another investment or stay away from sharp objects.
Sometimes the paycheck can seem insignificant when you say, oh I lost (or made) $3000 today.
Just overstating the obvious here, but you should be able to get spot+$2 when you sell. So, at the end of the month with spot at $27.08, that's $29.08 X 500 = $14,540. With a total loss of $345 if you were to buy on 1Jun and sell on 29Jun.
Doesn't look SO bad that way.
Too many positive BST transactions with too many members to list.