World wide central bank buying has been the major cause for higher prices. As the chart shows these central banks are trading their dollar holdings for gold. Gold is currently 25% of their holdings of foreign reserves. In 1980 gold was 75% of their foreign reserve holdings. They are not afraid to fill their vaults with gold and will likely continue to do so. Result? Much higher gold.
If you understand what is coming, then you can duck. If not, then you get sucker-punched. - Martin Armstrong
From the "Greed & Fear Report" (I'll bet a bunch of you are subscribers ):
"...At the peak of the last secular bull market in gold in January 1980, the gold price was then equivalent to 9.9%
of US disposable income per capita which was then US$8,551. The gold price is now US$3,670 or 5.6% of US
disposable income per capita of US$66,100.....To reach 9.9% of US disposable income per capita means gold should rise to US$6,571. This means that a price of US$6,600/oz is now a reasonable price target for gold at the peak of the current secular bull market.
@GoldFinger1969 said:
From the "Greed & Fear Report" (I'll bet a bunch of you are subscribers ):
"...At the peak of the last secular bull market in gold in January 1980, the gold price was then equivalent to 9.9%
of US disposable income per capita which was then US$8,551. The gold price is now US$3,670 or 5.6% of US
disposable income per capita of US$66,100.....To reach 9.9% of US disposable income per capita means gold should rise to US$6,571. This means that a price of US$6,600/oz is now a reasonable price target for gold at the peak of the current secular bull market.
Well, in 1980 an ounce of gold could buy 1 share of the Dow Jones Industrial average. So a reasonable price of gold in this secular bull market would be $45,000!!
I can't believe the "greed and fear report" didnt use this stat. They are off their game!!
@RedneckHB said:
Well, in 1980 an ounce of gold could buy 1 share of the Dow Jones Industrial average. So a reasonable price of >gold in this secular bull market would be $45,000!!
I can't believe the "greed and fear report" didnt use this stat. They are off their game!!
You can pick any data point and equalize it over time, in nominal or real terms. It's all a game.
I think gold continues to go higher. I just wonder if the peak is 2 years out or 10-15 years out. I think this secular bull started in 2020 and should go to at least 2030.
I didnt pick the date....your article did!!
My point was not the date, but rather using some arbitrary data to make a claim...something this forum is quite adept at.
all data is arbitrary to someone. What matters is "is it true?" If it's true then it is totally acceptable to present it to make a point. The problem is, if someone doesn't agree with or like the true data, they attack the data, calling it everything but "true."
You choose your data/chart and i'll choose mine. Just make sure it's accurate.
If you understand what is coming, then you can duck. If not, then you get sucker-punched. - Martin Armstrong
@ProofCollection said:
I've got technical targets for Platinum at $1750 in the near term (within 6 months) and $6500's longer term. $150-ish silver. $13-15k for gold.
careful, or you'll get accused of cherry picking data. LOL
If you understand what is coming, then you can duck. If not, then you get sucker-punched. - Martin Armstrong
@ProofCollection said:
I've got technical targets for Platinum at $1750 in the near term (within 6 months) and $6500's longer term. $150-ish silver. $13-15k for gold.
Target ^NRTH! Quite aggressive but perhaps someday. THKS!
The whole worlds off its rocker, buy Gold™.
BOOMIN!™
Wooooha! Did someone just say it's officially "TACO™" Tuesday????
@RedneckHB said:
I didnt pick the date....your article did!!
My point was not the date, but rather using some arbitrary data to make a claim...something this forum is quite >adept at.
I thought it was an interesting article, didn't say I believed every word in it.
My point was not the date, but rather using some arbitrary data to make a claim...something this forum is quite adept at.
the claims are arbitrary, dates/data/charts are most always accurate on this forum. Those that don't like a claim being backed up by correct data will usually declare the data "aribtrary."
If you understand what is coming, then you can duck. If not, then you get sucker-punched. - Martin Armstrong
@ProofCollection said:
I've got technical targets for Platinum at $1750 in the near term (within 6 months) and $6500's longer term. $330-ish silver. $13-15k for gold.
Can you share your data / chart that suggests silver going to $330? What time frame is that? Is the S&P 66.000 at that point?
@derryb said:
the claims are arbitrary, dates/data/charts are most always accurate on this forum. Those that don't like a claim >being backed up by correct data will usually declare the data "aribtrary."
"Accurate" data doesn't mean it is complete. And a true financial professional knows that volatility, risk-adjusted returns, timing bias, and rolling periods all need to be accounted for.
You can't sell performance based on a starting and ending point and expect any true investment professional to accept those results EVEN IF they are 100% "accurate."
@ProofCollection said:
I've got technical targets for Platinum at $1750 in the near term (within 6 months) and $6500's longer term. $330-ish silver. $13-15k for gold.
I see nothing to justify those LT targets anytime in the next 5-10 years. Anything beyond that is totally speculative.
I'm bullish gold but hard-pressed to project higher than $7-$10K. $300 for silver is a 7-fold rise from here. Without dedicated institutional buyers like CBs or SWFs, who is going to buy silver at $75 let alone $100 or $150 ?
@derryb said:
the claims are arbitrary, dates/data/charts are most always accurate on this forum. Those that don't like a claim >being backed up by correct data will usually declare the data "aribtrary."
"Accurate" data doesn't mean it is complete. And a true financial professional knows that volatility, risk-adjusted returns, timing bias, and rolling periods all need to be accounted for.
You can't sell performance based on a starting and ending point and expect any true investment professional to accept those results EVEN IF they are 100% "accurate."
yet daily, weekly and monthly charts are used by the "investment professionals" to give advice and make decisions. You didn't define "complete data" so I will assume you are talking about all data. All data is mostly useless because it includes anomolies (Hunt Brothers, 08 crisis, etc.). When reviewing data the smart investor (or advisor) looks at pertinent data. Pertinent data is rarely complete data. For me, pertinent data is a review of a number of time periods such as daily, weekly, monthly and sometimes "all data" charts.
I agree that accurate data is not the same as all data, however it is used to provide relevant data. The price of silver over the last two hundred years is irrelevant. What is relevant is its more recent (weekly, monthly yearly) movement.
If you understand what is coming, then you can duck. If not, then you get sucker-punched. - Martin Armstrong
@ProofCollection said:
I've got technical targets for Platinum at $1750 in the near term (within 6 months) and $6500's longer term. $330-ish silver. $13-15k for gold.
I see nothing to justify those LT targets anytime in the next 5-10 years. Anything beyond that is totally speculative.
That's because you're not using advanced proprietary technical analysis techniques that I am.
I'm bullish gold but hard-pressed to project higher than $7-$10K. $300 for silver is a 7-fold rise from here. Without dedicated institutional buyers like CBs or SWFs, who is going to buy silver at $75 let alone $100 or $150 ?
Why wouldn't there be institutional and industrial buyers? Who's to say that the USD isn't going to lose half or more of its current buying power? In case you haven't noticed there's a global debt crisis. The debt and deficit levels of the US and countries around the world cannot be sustained. It's only a matter of time. Trump wants lower rates but how much demand is there really for debt at 4% or less when real inflation is running at that rate or higher?
@derryb said:
the final fight is on to save dollar's world status. focus is on beating down any competition, especially BRICS.
The era of a world reserve currency (if that's what you are referring to) is over. Crypto & digital money have made that concept obsolete.
Crypto won't even exist in 20 years.
they will become a victim of Central Bank Digital Currencies. All forms of currency will disappear. Those that cannot fit into the scheme of things (gold?) will be outlawed or taxed to the point of making them worthless.
They will be victim of what they are.
an overnight fad? LOL
In it's 14 years of existence bitcoin has risen from $8 to $113,000.
@derryb said:
yet daily, weekly and monthly charts are used by the "investment professionals" to give advice and make decisions.
That has nothing to do with a sales pitch to a potential or actual client. Nobody uses charts for those presentations.
You didn't define "complete data" so I will assume you are talking about all data. All data is mostly useless because >it includes anomolies (Hunt Brothers, 08 crisis, etc.). When reviewing data the smart investor (or advisor) looks at >pertinent data. Pertinent data is rarely complete data. For me, pertinent data is a review of a number of time >periods such as daily, weekly, monthly and sometimes "all data" charts.
Longer time periods are better, but they still have timing bias. Rolling time periods eliminates that problem.
@ProofCollection said:
I've got technical targets for Platinum at $1750 in the near term (within 6 months) and $6500's longer term. $330-ish silver. $13-15k for gold.
Looks like I'm not the only one seeing $6500 gold.
@derryb said:
the final fight is on to save dollar's world status. focus is on beating down any competition, especially BRICS.
The era of a world reserve currency (if that's what you are referring to) is over. Crypto & digital money have made that concept obsolete.
Crypto won't even exist in 20 years.
they will become a victim of Central Bank Digital Currencies. All forms of currency will disappear. Those that cannot fit into the scheme of things (gold?) will be outlawed or taxed to the point of making them worthless.
They will be victim of what they are.
an overnight fad? LOL
In it's 14 years of existence bitcoin has risen from $8 to $113,000.
Has Moonlight Mint considered minting these. I believe it would be a hit.
.
I did mint those, and I offered them for sale for a few months (no longer available now). They were not a "hit". But I never figured on selling a large quantity of them, regardless. The mintage figures are shown here (see the 3rd section from the top): moonlightmint.com/dc-coin_hard_times_list.htm
@derryb said:
the final fight is on to save dollar's world status. focus is on beating down any competition, especially BRICS.
The era of a world reserve currency (if that's what you are referring to) is over. Crypto & digital money have made that concept obsolete.
Crypto won't even exist in 20 years.
they will become a victim of Central Bank Digital Currencies. All forms of currency will disappear. Those that cannot fit into the scheme of things (gold?) will be outlawed or taxed to the point of making them worthless.
They will be victim of what they are.
an overnight fad? LOL
In it's 14 years of existence bitcoin has risen from $8 to $113,000.
Has Moonlight Mint considered minting these. I believe it would be a hit.
They seem to want to pass up on many of the GREAT ideas...and......disclaimer......sorry not trying to cancel/offend anyone, just my personal experience. RGDS!
The whole worlds off its rocker, buy Gold™.
BOOMIN!™
Wooooha! Did someone just say it's officially "TACO™" Tuesday????
@DoubleEagle59 said:
Hardly any mention of this in the controlled media.
They' really don't want you to own gold.
I see plenty of gold talk on CNBC, FBC, and Bloomberg.
I see no controlled media, just a proper focus on equities and fixed income. PMs should NOT dominate the discussion.
Yes, anytime I turn on the TV it seems I am not unable to run across a buy gold/gutter commercial/infomercial/sermon/etc. The strangest part is the retail "stacker" is nowhere to be found. I suspect because paper made it so damn simple. Onward and Upwards. SMPR!!
The whole worlds off its rocker, buy Gold™.
BOOMIN!™
Wooooha! Did someone just say it's officially "TACO™" Tuesday????
Comments
k 3650
f 3692
$3700+ hit this morning.
http://ProofCollection.Net
$3641 over here in The Commonwealth. I do see a daily high of $3669. THKS!
The whole worlds off its rocker, buy Gold™.
BOOMIN!™
Wooooha! Did someone just say it's officially "TACO™" Tuesday????
World wide central bank buying has been the major cause for higher prices. As the chart shows these central banks are trading their dollar holdings for gold. Gold is currently 25% of their holdings of foreign reserves. In 1980 gold was 75% of their foreign reserve holdings. They are not afraid to fill their vaults with gold and will likely continue to do so. Result? Much higher gold.
If you understand what is coming, then you can duck. If not, then you get sucker-punched. - Martin Armstrong
k 3641
And, thanks to an interest rate drop. . .
If you understand what is coming, then you can duck. If not, then you get sucker-punched. - Martin Armstrong
From the "Greed & Fear Report" (I'll bet a bunch of you are subscribers") ):
):
"...At the peak of the last secular bull market in gold in January 1980, the gold price was then equivalent to 9.9%
of US disposable income per capita which was then US$8,551. The gold price is now US$3,670 or 5.6% of US
disposable income per capita of US$66,100.....To reach 9.9% of US disposable income per capita means gold should rise to US$6,571. This means that a price of US$6,600/oz is now a reasonable price target for gold at the peak of the current secular bull market.
Well, in 1980 an ounce of gold could buy 1 share of the Dow Jones Industrial average. So a reasonable price of gold in this secular bull market would be $45,000!!
I can't believe the "greed and fear report" didnt use this stat. They are off their game!!
Lol
Knowledge is the enemy of fear
You can pick any data point and equalize it over time, in nominal or real terms. It's all a game.
I think gold continues to go higher. I just wonder if the peak is 2 years out or 10-15 years out. I think this secular bull started in 2020 and should go to at least 2030.
I didnt pick the date....your article did!!
My point was not the date, but rather using some arbitrary data to make a claim...something this forum is quite adept at.
Knowledge is the enemy of fear
all data is arbitrary to someone. What matters is "is it true?" If it's true then it is totally acceptable to present it to make a point. The problem is, if someone doesn't agree with or like the true data, they attack the data, calling it everything but "true."
You choose your data/chart and i'll choose mine. Just make sure it's accurate.
If you understand what is coming, then you can duck. If not, then you get sucker-punched. - Martin Armstrong
I've got technical targets for Platinum at $1750 in the near term (within 6 months) and $6500's longer term. $330-ish silver. $13-15k for gold.
http://ProofCollection.Net
careful, or you'll get accused of cherry picking data. LOL
If you understand what is coming, then you can duck. If not, then you get sucker-punched. - Martin Armstrong
I've got technical targets for Platinum at $1750 in the near term (within 6 months) and $6500's longer term. $150-ish silver. $13-15k for gold.
It could happen, and it wouldn't be the first time in history that something like that has happened.
I knew it would happen.
Target ^NRTH! Quite aggressive but perhaps someday. THKS!
The whole worlds off its rocker, buy Gold™.
BOOMIN!™
Wooooha! Did someone just say it's officially "TACO™" Tuesday????
I thought it was an interesting article, didn't say I believed every word in it.")
the claims are arbitrary, dates/data/charts are most always accurate on this forum. Those that don't like a claim being backed up by correct data will usually declare the data "aribtrary."
If you understand what is coming, then you can duck. If not, then you get sucker-punched. - Martin Armstrong
$3750+ tonight.
http://ProofCollection.Net
Can you share your data / chart that suggests silver going to $330? What time frame is that? Is the S&P 66.000 at that point?
"Accurate" data doesn't mean it is complete. And a true financial professional knows that volatility, risk-adjusted returns, timing bias, and rolling periods all need to be accounted for.
You can't sell performance based on a starting and ending point and expect any true investment professional to accept those results EVEN IF they are 100% "accurate."
I see nothing to justify those LT targets anytime in the next 5-10 years. Anything beyond that is totally speculative.
I'm bullish gold but hard-pressed to project higher than $7-$10K. $300 for silver is a 7-fold rise from here. Without dedicated institutional buyers like CBs or SWFs, who is going to buy silver at $75 let alone $100 or $150 ?
yet daily, weekly and monthly charts are used by the "investment professionals" to give advice and make decisions. You didn't define "complete data" so I will assume you are talking about all data. All data is mostly useless because it includes anomolies (Hunt Brothers, 08 crisis, etc.). When reviewing data the smart investor (or advisor) looks at pertinent data. Pertinent data is rarely complete data. For me, pertinent data is a review of a number of time periods such as daily, weekly, monthly and sometimes "all data" charts.
I agree that accurate data is not the same as all data, however it is used to provide relevant data. The price of silver over the last two hundred years is irrelevant. What is relevant is its more recent (weekly, monthly yearly) movement.
If you understand what is coming, then you can duck. If not, then you get sucker-punched. - Martin Armstrong
That's because you're not using advanced proprietary technical analysis techniques that I am.
Why wouldn't there be institutional and industrial buyers? Who's to say that the USD isn't going to lose half or more of its current buying power? In case you haven't noticed there's a global debt crisis. The debt and deficit levels of the US and countries around the world cannot be sustained. It's only a matter of time. Trump wants lower rates but how much demand is there really for debt at 4% or less when real inflation is running at that rate or higher?
http://ProofCollection.Net
3775 cash
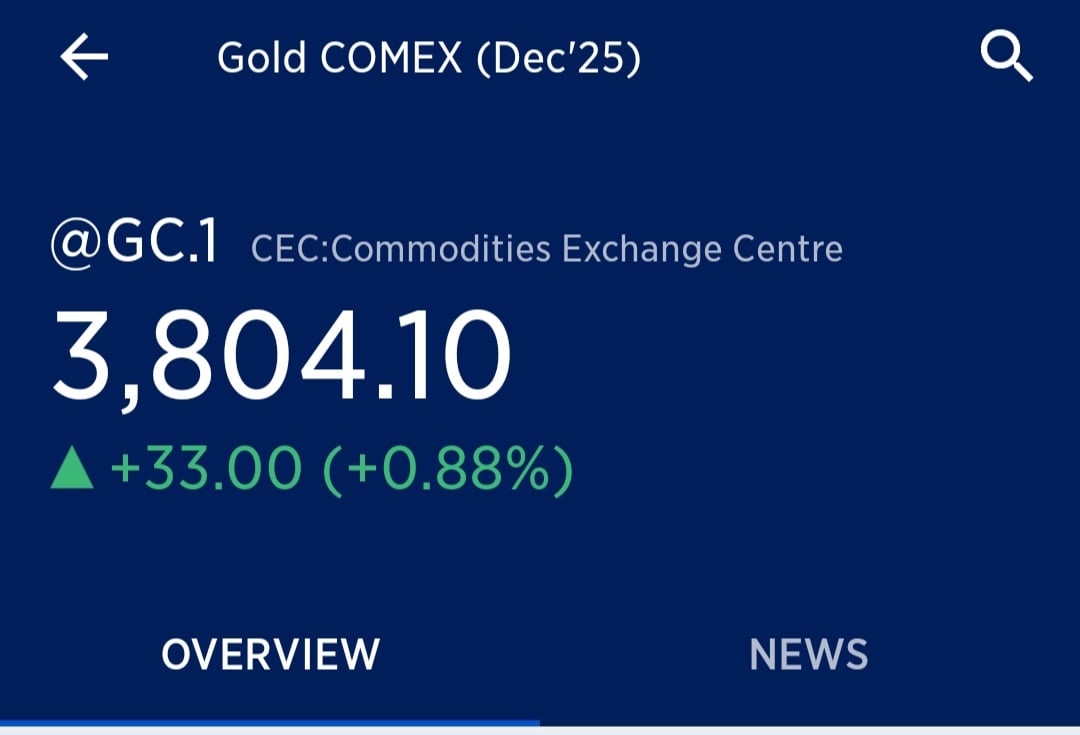
3800 futs
Hardly any mention of this in the controlled media.
'They' really don't want you to own gold.
"“Those who sacrifice liberty for security/safety deserve neither.“(Benjamin Franklin)
"I only golf on days that end in 'Y'" (DE59)
The parallels between Weimar, Gold, Stock Market and Zimbabwe are significant.
I knew it would happen.
Has Moonlight Mint considered minting these. I believe it would be a hit.
Gold is telling us some very bad things about our dollars.
If you understand what is coming, then you can duck. If not, then you get sucker-punched. - Martin Armstrong
Rather as @derryb alludes to, they don't want you to see your dollar going down.
http://ProofCollection.Net
That has nothing to do with a sales pitch to a potential or actual client. Nobody uses charts for those presentations.
Longer time periods are better, but they still have timing bias. Rolling time periods eliminates that problem.
I see plenty of gold talk on CNBC, FBC, and Bloomberg.
I see no controlled media, just a proper focus on equities and fixed income. PMs should NOT dominate the discussion.
C> @GoldFinger1969 said:
i said they were used to give advice and make decisions. I take it you disagree with this.
If you understand what is coming, then you can duck. If not, then you get sucker-punched. - Martin Armstrong
Why:
If you understand what is coming, then you can duck. If not, then you get sucker-punched. - Martin Armstrong
Looks like I'm not the only one seeing $6500 gold.
https://www.msn.com/en-in/money/markets/gold-price-target-of-6-600-is-now-reasonable-says-jefferies-chris-wood-here-s-why/ar-AA1MTcQ1?ocid=socialshare
http://ProofCollection.Net
The limit on the price of gold will be determined by the future of the dollar.
If you understand what is coming, then you can duck. If not, then you get sucker-punched. - Martin Armstrong
.
I did mint those, and I offered them for sale for a few months (no longer available now). They were not a "hit". But I never figured on selling a large quantity of them, regardless. The mintage figures are shown here (see the 3rd section from the top): moonlightmint.com/dc-coin_hard_times_list.htm
.
@dcarr,
Love the description on your website for the various design elements. Nicely done!
They seem to want to pass up on many of the GREAT ideas...and......disclaimer......sorry not trying to cancel/offend anyone, just my personal experience. RGDS!
The whole worlds off its rocker, buy Gold™.
BOOMIN!™
Wooooha! Did someone just say it's officially "TACO™" Tuesday????
Yes, anytime I turn on the TV it seems I am not unable to run across a buy gold/gutter commercial/infomercial/sermon/etc. The strangest part is the retail "stacker" is nowhere to be found. I suspect because paper made it so damn simple. Onward and Upwards. SMPR!!
The whole worlds off its rocker, buy Gold™.
BOOMIN!™
Wooooha! Did someone just say it's officially "TACO™" Tuesday????
we're back!
Future this:
3784 kitco
3815.80 kitco
futs 3858
futs 3875
We're heading for a $4,000 handle....nobody should be surprised.