Options
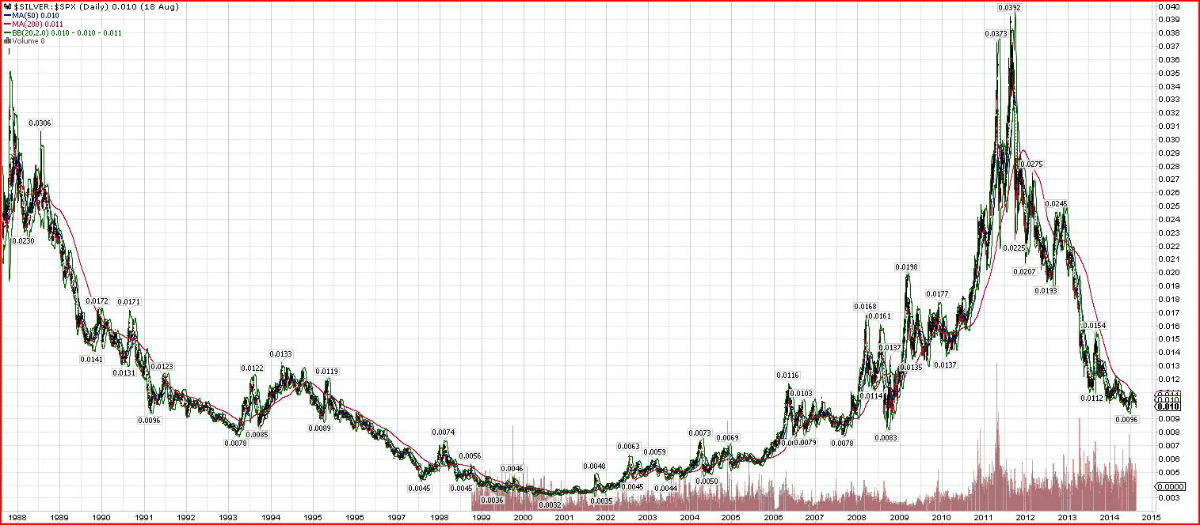
For our resident chart linguists, what does this chart say?
 RedneckHB
Posts: 20,155 ✭✭✭✭✭
RedneckHB
Posts: 20,155 ✭✭✭✭✭
Excuses are tools of the ignorant
Knowledge is the enemy of fear
0
Comments
Do not try to time it. Just do it.
"A car is a tool that takes you from one place to another. Everything beyond that is a payment for other people's perception of you."
<< <i>looks like a beautiful cup... >>
With a broken handle.
Convert equities into silver
Perhaps, but still a rather nasty downtrend.
But rather than speculate, I would like to point out the facts. The most glaring that I see it that equal investments in silver and the SP-500 in 1991 would be worth the same today. (Stocks probably worth more due to dividends). For 2 decades and through many cycles (economic, political, global, legislative, judicial, technological, ect) these 2 different asset classes have given the same returns.
Knowledge is the enemy of fear
Too many positive BST transactions with too many members to list.
<< <i>The most glaring that I see it that equal investments in silver and the SP-500 in 1991 would be worth the same today. (Stocks probably worth more due to dividends). For 2 decades and through many cycles (economic, political, global, legislative, judicial, technological, ect) these 2 different asset classes have given the same returns. >>
Only with a buy and hold strategy. Buy and hold is dead.
"A car is a tool that takes you from one place to another. Everything beyond that is a payment for other people's perception of you."
This is why I've stated so many times that over the course of one lifetime all asset classes will have similar returns. And if those assets are all based on a common denominator, such as the US dollar, those returns will be largely based on debasement or inflation. PMs are no more special than other assets.
Knowledge is the enemy of fear
What goes down must come up.
<< <i>This is why I've stated so many times that over the course of one lifetime all asset classes will have similar returns. And if those assets are all based on a common denominator, such as the US dollar, those returns will be largely based on debasement or inflation. PMs are no more special than other assets. >>
Savings is an asset. Savings has never kept up with inflation.
"A car is a tool that takes you from one place to another. Everything beyond that is a payment for other people's perception of you."
<< <i>
<< <i>This is why I've stated so many times that over the course of one lifetime all asset classes will have similar returns. And if those assets are all based on a common denominator, such as the US dollar, those returns will be largely based on debasement or inflation. PMs are no more special than other assets. >>
Savings is an asset. Savings has never kept up with inflation. >>
By savings I assume you mean the US dollar. "Savings" is not an asset class in and of itself. Since this has been continually debased it, by definition, cannot keep up with inflation.
If your savings is in the form of "rare" artifacts, real estate, PMs, equities or debt instruments, then you will find that all have very similar rates of return over long periods of time.
Knowledge is the enemy of fear
Let's see what the Fed does or doesn't do.
So many fundamental changes have taken place in the financial system since 1987 that it really doesn't make as much sense to compare the earlier part of the chart to the later part of the chart, in my opinion. You are looking at the effects of policy actions as much as you are looking at market dynamics.
Which tells me that future policy action is as important, or more important than market fundamentals. My opinion.
I knew it would happen.
I didnt say I think the ratio will drop to .0032. The floor is probably .008. Not sure I would be looking for a "V" bottom either.
So many fundamental changes have taken place in the financial system since 1987 that it really doesn't make as much sense to compare the earlier part of the chart to the later part of the chart, in my opinion. You are looking at the effects of policy actions as much as you are looking at market dynamics.
Stop trying to make excuses. Prices are as they are and reflect any and all "fundamental changes". Just focus on the chart pattern, and only on the chart pattern.
Knowledge is the enemy of fear
The neckline was a 45% drop from the 2011 all time high. When the neckline broke down at approx 0.020 the 45% ratio of the first decline projects this last decline down to 0.009. And that's the current low.
Even better, the uptrend line from the 2001 bottom was perfectly tagged by this year's low.
There's even a nice support line that was also tagged that incorporates the 1990 and 2006 highs. All of the above suggesting silver should be better than the S&P going forward. Looks like the decline will be
officially over once this 1-2 year ending diagonal pattern completes. It has definitely lost some steam in the past 13 months.
Knowledge is the enemy of fear
``https://ebay.us/m/KxolR5
<< <i>Convert equities into silver.
very possibly derryb. Good work.
"A car is a tool that takes you from one place to another. Everything beyond that is a payment for other people's perception of you."
Knowledge is the enemy of fear
<< <i>Maybe derryb, but roadrunner did provide reasoning. I just hope we are not a decade into the PM bear market before it turns. >>
Very possibly cohodk, if history rhymes.
<< <i>Maybe derryb, but roadrunner did provide reasoning. I just hope we are not a decade into the PM bear market before it turns. >>
I don't think that's likely. Armstrong's economic/business confidence models have been accurately charting the business cycles for a few decades now. I think he uses investment capital money flows in this model. His 8.6 year peaks have pretty much coincided with major stock market peaks within 0-12 months. The next ECM peak is September 2015. That's a logical point for the next general equities peak. The last ECM peak one was in the first half of 2007 and the SM peaked about 8 months after that. The model called for a confidence bottom in May 2009 (2 months after the SM bottomed). It just so happens that 10 ECM cycles is exactly the time period from Sept 1929 to Sept 2015. This all suggests that 2016-2019 will be a much more similar to 2007-2011 and 2011-2015 In any case it will probably be a much better time for silver than than the 2011-2014 period turned out to be.
If I had to predict the future of this measure, I'd probably go with "sideways"
Liberty: Parent of Science & Industry
Stop trying to make excuses. Prices are as they are and reflect any and all "fundamental changes". Just focus on the chart pattern, and only on the chart pattern.
Nobody's making "excuses". Excuses for what? Here's some commentary based on classical financial analysis. (There is such a thing, you know.)
From ZeroHedge:
"at 17X reported trailing earnings and that historically when the multiple has gotten into that zone after three years or more of market gains (we have had five) good things do not happen. But, yes, this time is different according to perma-bull Bianco because even though above 17 PEs are rare after many years of EPS growth, very low interest rates are even more rare and support higher PEs"
Zerohedge, quoted from Stockman's blog
At the risk of repeating myself, it's not your father's stock market.
I knew it would happen.
<< <i>Prices are as they are and reflect any and all "fundamental changes." >>
Like with real estate before the big pop? What put air in the real estate bubble? Wasn't fundamentals. Fundamentals let the air out. And, those things that did put the air in real estate have been dealt with and no longer exist, right?
"A car is a tool that takes you from one place to another. Everything beyond that is a payment for other people's perception of you."
edited to try to get chart to link, this one seems to be working. It's easy to see the bull and bear markets in the respective asset classes, the 2008-2009 "event" and aftermath
Liberty: Parent of Science & Industry
<< <i><<So many fundamental changes have taken place in the financial system since 1987 that it really doesn't make as much sense to compare the earlier part of the chart to the later part of the chart, in my opinion. You are looking at the effects of policy actions as much as you are looking at market dynamics.>>
Stop trying to make excuses. Prices are as they are and reflect any and all "fundamental changes". Just focus on the chart pattern, and only on the chart pattern.
Nobody's making "excuses". Excuses for what? Here's some commentary based on classical financial analysis. (There is such a thing, you know.)
From ZeroHedge:
"at 17X reported trailing earnings and that historically when the multiple has gotten into that zone after three years or more of market gains (we have had five) good things do not happen. But, yes, this time is different according to perma-bull Bianco because even though above 17 PEs are rare after many years of EPS growth, very low interest rates are even more rare and support higher PEs"
Zerohedge, quoted from Stockman's blog
At the risk of repeating myself, it's not your father's stock market. >>
Lol, that's not financial analysis, that's talking ones book....
<< <i> And you are correct, the drop from 0.0096 to 0.0032 can still be huge.
>>
Well jmski52, half of that downside risk was realized in just a few months. How about now?
Knowledge is the enemy of fear