Has this made a H&S top?
 RedneckHB
Posts: 20,132 ✭✭✭✭✭
RedneckHB
Posts: 20,132 ✭✭✭✭✭
If so, implications?
Excuses are tools of the ignorant
Knowledge is the enemy of fear
0
Comments
Anyway, the current level of 64.15 means that the current price of gold is 641.5 times the yield of the 10yr treasury (2.16%).
Knowledge is the enemy of fear
I could be wrong about this, but I don't think that you can compare a price value of one type of asset to the yield value of a different type of asset and have it be meaningful.
I think that this chart shouldn't exist.
If you think that a relationship exists between these two sets of numbers, you should be tracking the correlation coeffiecient.
I suspect that such a calculation would indicate a low correlation coefficient.
I knew it would happen.
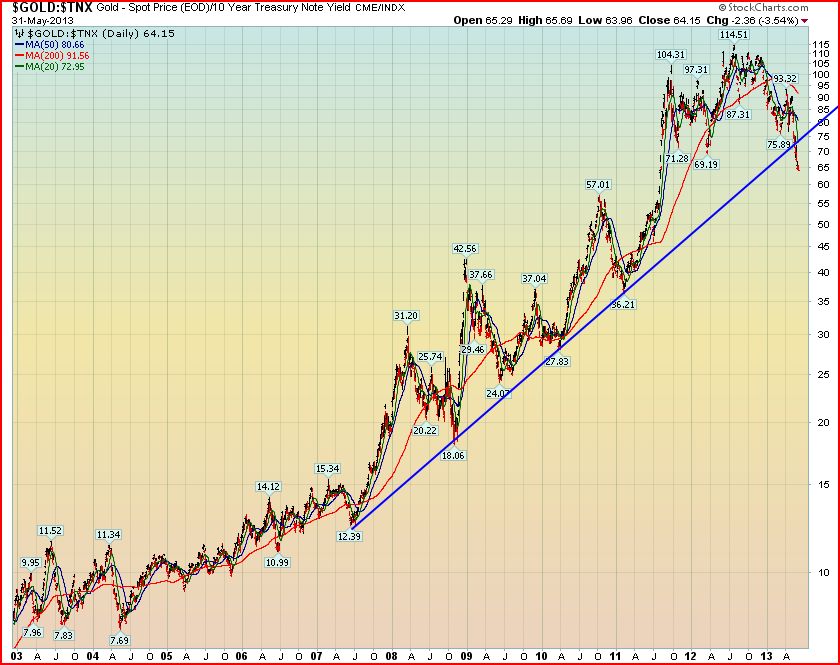
<< <i>Just in case you cant interpret this chart it is the ratio of gold to the yield of the 10yr Treasury. I posted this chart in late 2011 on the parabolic move to 104, stating at the time the move was unsustainable and would revert to a mean. If someone could find this discussion I would greatly appreciate it.
Anyway, the current level of 64.15 means that the current price of gold is 641.5 times the yield of the 10yr treasury (2.16%). >>
Yeah I've nothing better to do right now
Is this it?
What Market forces were there 3-4 years ago have vanished with artificially low interest rates forcing everyone to look for Yields, combined with a COMEX that is simply a rig market.
To put COMEX Gold and 10 Year T-Bills in a Ratio is not reliable anymore. You might as well turn the chart upside down from 2008 to now.
Deteriorating economic data? Check. No volume? Check. Increasing expectations the Fed will taper? Check. So what does a "stock market" do - it tags along to the USDJPY which ramps just because it bounces off the 101 algorithmic support level, and just happens to take the S&P up 10 points with it. Then EUR takes over for the ramp. New normal "trading"...
what were you thinking?
BTW, I still don't understand the manipulation argument. Is there manipulation in markets by many forces?...yes, Is it just the last few years?
Of course not. Tulips, sulfur, stocks, metals, bonds, jewels and any other asset have been manipulated directly or indirectly for as long as they have been around....ultimately, with limited longterm effect, imo.
This chart could be of the number of germinating seeds on a sunflower vs the number of honeybees or of the number of Bernanke cartoons vs silver price. The actual data doesnt matter, but rather the pattern that develops. This really does look like a H&S top and if it does develop as such then we would expect the plot of data to go down to about 30-35. So what does this mean? What would cause this graph to print in the 30's?
Well for one, I am kind of seeing decent news for gold. At least in the sense that I can see a potential floor. What one needs to do is look at the two charts which we are comparing--the 10yr yield and gold. Analyse these and you will probably see the floor that I see. Anyone want to take a stab at it?
Knowledge is the enemy of fear
Charts account for all "rigging" or "manipulation".
Tulips, sulfur, stocks, metals, bonds, jewels and any other asset have been manipulated directly or indirectly for as long as they have been around....ultimately, with limited longterm effect, imo.
Exactly. Nothing is bigger than the market (for each asset).
Knowledge is the enemy of fear
Can you derive some predictability from two charts that don't "match up" by changing the scale on one of the charts to something that causes the two charts to look similar? In other words, if you take a 10 year chart for gold and compress the time scale to 1 month, can you derive some meaning if that modified chart matches identically to the 1 month chart for call options in Tesla? You seem to be saying that such a phenomenon will have meaning. I don't see how it possibly could.
I knew it would happen.
<< <i>I'm not being facetious, but are you saying that two variables don't necessarily need to have a correlation in order for their overlapping charts to have some meaning?
Can you derive some predictability from two charts that don't "match up" by changing the scale on one of the charts to something that causes the two charts to look similar? In other words, if you take a 10 year chart for gold and compress the time scale to 1 month, can you derive some meaning if that modified chart matches identically to the 1 month chart for call options in Tesla? You seem to be saying that such a phenomenon will have meaning. I don't see how it possibly could. >>
It seems that the concept is the classic economic relationships among Supply, Demand, and Price, along with Elasticity of demand and Availability of substitutes.
does gold become more or less attractive to investors, in the aggregate, when interest rates are higher?
in other words, if a significant proportion of the gold bull run was fueled by investors seeking gains by buying gold in a near zero-rate environment, what happens, hypothetically, if interest rates rise while gold prices oscillate and trend down? What will a percentage of those investors choose to do? and what will be the effects of their actions?
Liberty: Parent of Science & Industry
If the real interest rate is low or negative, this implies that various things will happen when rates turn around and go the other direction. My reason for buying gold in a low interest rate environment is specifically because of what I know will happen to the stock market and the debt load when rates begin to rise.
I anticipate that the stock market will swoon and the increases in debt will accelerate, leaving gold and silver as the obvious safe havens. I anticipate that these problems will then result in a liquidity crunch, which the Fed will attempt to alleviate by flooding the markets with more money creation. This will finally light the real fire under gold & silver. Everything up to that point is just a prelude.
That's as far as I will predict. Willie and Sinclair take the scenario a few steps further, and I think that it's very likely that the BRICs will collaborate with the Saudis and Europe to form a different trade settlement mechanism other than the US dollar.
Things are different now than in 1979-1980. I don't think that the spike and subsequent correction will be the same as then. I don't think that anyone really knows which direction things will head once the worldwide T-bond bubble breaks. We've never had anything like it.
I knew it would happen.
<< <i>I'm not being facetious, but are you saying that two variables don't necessarily need to have a correlation in order for their overlapping charts to have some meaning?
Can you derive some predictability from two charts that don't "match up" by changing the scale on one of the charts to something that causes the two charts to look similar? In other words, if you take a 10 year chart for gold and compress the time scale to 1 month, can you derive some meaning if that modified chart matches identically to the 1 month chart for call options in Tesla? You seem to be saying that such a phenomenon will have meaning. I don't see how it possibly could. >>
YES. Chart patterns are patterns. They care nothing about supposed "fundamentals".
Here is gold and Walmart. Similar patterns with what I think could be similar results. If you want me to prepare gold vs TSLA I will.
WMT from 1995 to 2000 looks quite similar to gold from 2000 to 2011, albeit a quicker ascent. Since golds rally was spread out over a few more years, the subsequent consolidation could be a few years shorts since gold had more opportunities to self-correct. So instead of a 10 year consolidation, maybe gold only sits for 5.
Knowledge is the enemy of fear
What we'd get is gold from 1977-1980 when interest rates finally did rise after a fairly stagnant first half of the 1970's. Rates doubled in 2 yrs from Jan 1978 to Jan 1980.
It sure didn't hurt gold any which went up 8X in price. The reasons gold will rise for this 2nd half of the gold bull will be somewhat different than the first half.
<< <i>The reasons gold will rise for this 2nd half of the gold bull will be somewhat different than the first half. >>
correct. bizarro world is in the cards.
When gold and silver move together, it signals the coming end of fiat money.
We "may" be making a H&S bottom for the 10yr yield. This would project to the 3.4% area and the chart might look like this.
If the Gold:10yr yield ratio trades to the 30-40 area and yields are 3.4%, then the price of gold would be $1020 to $1360. This is a VERY WIDE ballpark estimate, so if we use the middle, then 1150 to 1250 is a likely target. A 38% retrace of the 10yr bull would target 1250 to 1300, while a 50% retrace would be about $1075 to $1150. Again we get a ballpark of $1150 to $1250.
A backup in rates to the "astronomical" level of 4%, would, IMO, have very little impact on our economy. In fact, it might even make it healthier, as savers get more income and investors are paid to take risk. This might even bring about a little inflation.
Knowledge is the enemy of fear
<< <i>
<< <i>The reasons gold will rise for this 2nd half of the gold bull will be somewhat different than the first half. >>
correct. bizarro world is in the cards. >>
I agree. As I just mentioned, we might finally get a little inflation. Nothing bizarro about that. Just a return to the normalization that we have become so accustomed to over the past 100 years.
Knowledge is the enemy of fear
Knowledge is the enemy of fear
I could always be wrong, but I think that what you are seeing is a stress test of a rate increase.
I knew it would happen.
<< <i>All that said above, with gold at 1380, it certainly makes better sense to begin stacking now, than at $1800. And I just may begin to do that
Nice briefcase outta do it.
When gold and silver move together, it signals the coming end of fiat money.
I knew it would happen.
Knowledge is the enemy of fear
Business always contracts when rates rise, obamacare hasn't been felt yet, and tax rates are also bound to rise as business tax revenues fall - none of which will help cash flows, business or personal. All of this is deflationary, the very problem that Bernanke is about.
This gives the Fed license to flood the world market with even more dollars. How long before they double down on QE? Unemployment hasn't been fixed, neither has the housing market. Once 401Ks and home prices start back down in earnest, the only "fix" to these issues will be more liquidity. You heard it here first.
I knew it would happen.
<< <i>Back to the original thought....
We "may" be making a H&S bottom for the 10yr yield. This would project to the 3.4% area and the chart might look like this.
If the Gold:10yr yield ratio trades to the 30-40 area and yields are 3.4%, then the price of gold would be $1020 to $1360. This is a VERY WIDE ballpark estimate, so if we use the middle, then 1150 to 1250 is a likely target. A 38% retrace of the 10yr bull would target 1250 to 1300, while a 50% retrace would be about $1075 to $1150. Again we get a ballpark of $1150 to $1250.
A backup in rates to the "astronomical" level of 4%, would, IMO, have very little impact on our economy. In fact, it might even make it healthier, as savers get more income and investors are paid to take risk. This might even bring about a little inflation. >>
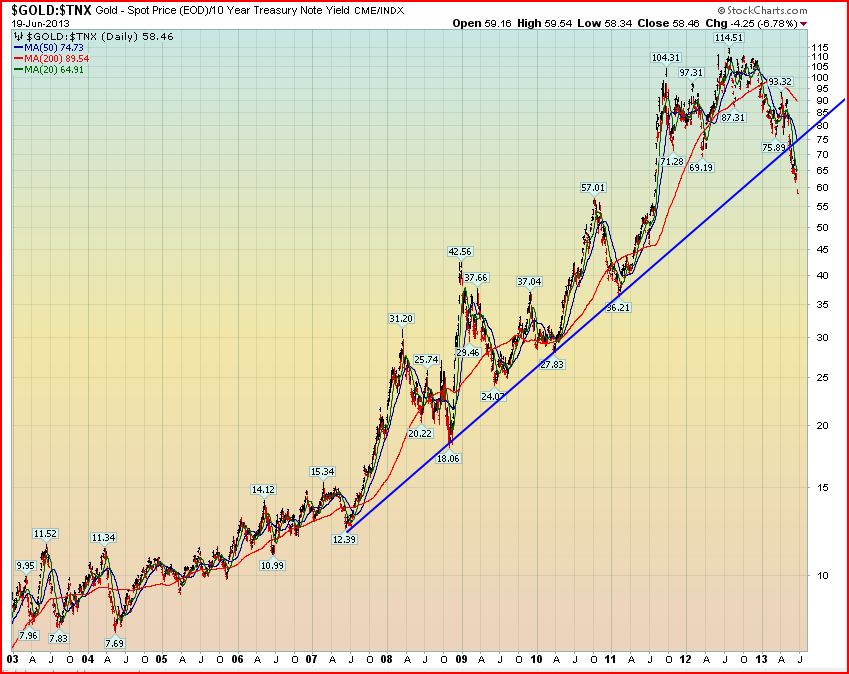
Update...
The chart is resolving itself more quickly. Downtrend and subsequent back test (occuring now) happening a bit faster. But again, direction and action foretold nicely by the chart.
Knowledge is the enemy of fear
<< <i>If so, implications?
Update on the OP. Dang charts did it again.
Knowledge is the enemy of fear
Ok now you finally put some real charts up ie Linear and bingo no head and shoulders. Its amazing what those distorted log charts, non true price 1 for 1 charts can do to give false signals.
<< <i>
<< <i>I'm not being facetious, but are you saying that two variables don't necessarily need to have a correlation in order for their overlapping charts to have some meaning?
Can you derive some predictability from two charts that don't "match up" by changing the scale on one of the charts to something that causes the two charts to look similar? In other words, if you take a 10 year chart for gold and compress the time scale to 1 month, can you derive some meaning if that modified chart matches identically to the 1 month chart for call options in Tesla? You seem to be saying that such a phenomenon will have meaning. I don't see how it possibly could. >>
YES. Chart patterns are patterns. They care nothing about supposed "fundamentals".
Here is gold and Walmart. Similar patterns with what I think could be similar results. If you want me to prepare gold vs TSLA I will.
WMT from 1995 to 2000 looks quite similar to gold from 2000 to 2011, albeit a quicker ascent. Since golds rally was spread out over a few more years, the subsequent consolidation could be a few years shorts since gold had more opportunities to self-correct. So instead of a 10 year consolidation, maybe gold only sits for 5.
When gold and silver move together, it signals the coming end of fiat money.
I used to think that way also. But after 25 years and probably close to 500,000 charts later, I realized that log charts are another useful tool. And like any tool they have their time and place. Not using the correct tool can often result in an improper fit.
take the WMT money and run, fast
The WMT chart is from 2002 and was presented to show the similarity of the pattern for WMT and Gold. The result of the pattern for WMT was a decade of nothingness. I feel there is very real potential for the chart of Gold to progress similarly over the next decade. Notice that WMT did again resume its uptrend, so hopefully this will be good for "stackers"......in 2022.
Knowledge is the enemy of fear