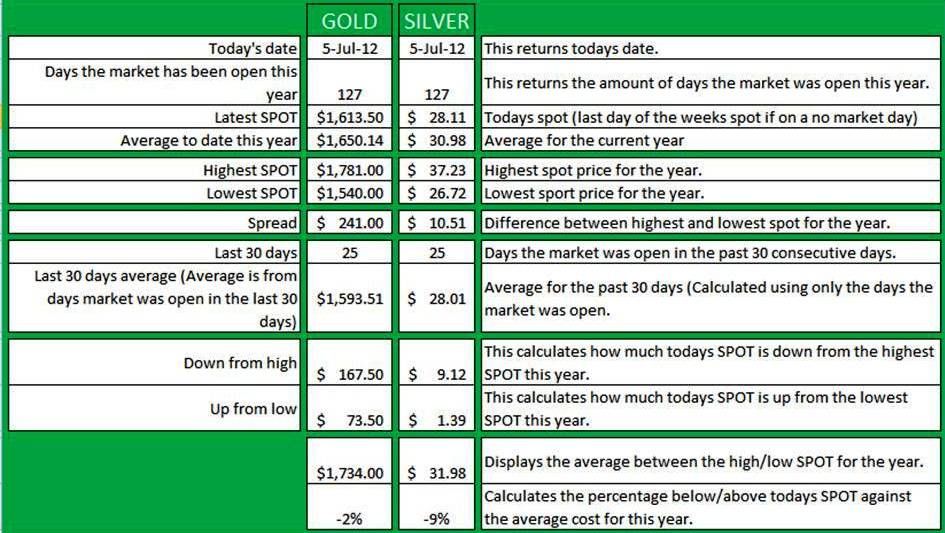
According to my calculations, Silver is 9% below the annual average.

I am trying to figure out how to use the "trend" and "Forecast" functions. All these boxes have formulas that auto calculate when I open or refresh the document. Just playing around.
Ray
0
Comments
Here's a warning parable for coin collectors...
<< <i>That's very cool, Ray! You come up with that? >>
Yes, its a work in progress. I'm hoping eventually I can use it to better plan opportunity purchases.
I don't see this as a prognosticator or guide in any way but hopefully I am wrong.
"past performance is no guarantee of future yields" etc
Thanks.
Watch for my listing here and over on the BST! SPAM!!
bob
Knowledge is the enemy of fear
<< <i>They make charts that will give you the same info in about 2 keystrokes. >>
All I have to do is open this one... no key strokes
And this one costs me... nothing
Plenty of free chart programs on the internet.
But as I relayed to another member, nothing gets you in touch with a market better than personally computing the numbers. Way back in the good ole before they had computers, I used to chart stocks by hand. UGH!!!
Knowledge is the enemy of fear
<< <i>I am not a math or statistics wiz but doesn't the data regarding silver just confirm the falling market it is in and nothing more?
I don't see this as a prognosticator or guide in any way but hopefully I am wrong.
"past performance is no guarantee of future yields" etc
Thanks. >>
You are correct in saying past performance is no guarante
e of future yields...
That said, its all the info we have at any given moment to make an educated guess.
<< <i>Dont you have to input the information everyday?
Plenty of free chart programs on the internet.
But as I relayed to another member, nothing gets you in touch with a market better than personally computing the numbers. Way back in the good ole before they had computers, I used to chart stocks by hand. UGH!!! >>
No, I set formulas up that go and pull the info from the internet every time I open it. (Or refresh the page)
I enjoy looking at these Ray. Just a different way of looking at things and how it's been going.
Too many positive BST transactions with too many members to list.
I would also like to see a list of the greatest BSers who post commentaries on Kitco, Marketswatch
The more qualities observed in a coin, the more desirable that coin becomes!
My Jefferson Nickel Collection
I assume my thought process is faltered but the way I see it buying below the average provides opportunity. It's like dollar cost averaging without actually spending money. Buy when it's below the average.
I'm going to add 7 day, 30 day, 60 day, 90 day averages too... see how they work out.
for example, graph the silver spot price on the Y vs. weeks on the X, for the past 18 months, then draw a straight line through the mountain peaks, and another straight line through the valley deeps.
then look at which way the lines are slanting, and whether they intersect, diverge, or are parallel in the future.
Liberty: Parent of Science & Industry
7 Days: The market has been open 6 days, average SPOT was $27.69 that puts this weeks SPOT down 10% from the annual average (129 days of open market).
30 Days: The market has been open 25 days, average SPOT was $28.00 that puts the 30 day period's SPOT down 9% from the annual average (129 days of open market).
60 Days: The market has been open 50 days, average SPOT was $28.53 that puts the 60 day period's SPOT down 8% from the annual average (129 days of open market).
90 Days: The market has been open 75 days, average SPOT was $29.65 that puts the 90 day period's SPOT down 4% from the annual average (129 days of open market).
With this info we can see the downward slant, from what I am reading we should not buy on the down slant (I guess this goes for the PM flippers). If you are trying to dollar cost average your stock pile. I say any time you can pick up some PMs that are below your average stock pile cost should be an asset to your pile since it brings your dollar cost average down... even if you are buying on the down slant. Right?
<< <i>it is really fun to play with numbers, and when you graph those numbers, interesting patterns emerge.
for example, graph the silver spot price on the Y vs. weeks on the X, for the past 18 months, then draw a straight line through the mountain peaks, and another straight line through the valley deeps.
then look at which way the lines are slanting, and whether they intersect, diverge, or are parallel in the future. >>
I did just that
I took note that there was 15 down from the previous week and 11 up from the previous week. Just plugging in the numbers I watched the downward trend since about mid January. Where does it end? (Rhetorical question)
Thinking out loud here...
As a stacker... It's best to dollar cost average by making multiple purchases over a long period of time right?
As a flipper... it's best to watch the trends and try to purchase on the dips... right?
That said, as a flipper, how far back do you watch? Weeks? months? Or is it a percentage of spot in a days drop?
Thanks for your time,
Ray
Knowledge is the enemy of fear