Some interesting pop report findings
 JHS5120
Posts: 1,968 ✭✭✭
JHS5120
Posts: 1,968 ✭✭✭
I decided to analyze the PSA pop report in some detail today. I wanted to find the average grade for each regular issue Topps set. It actually wasn't too hard, I transferred the data from the pop report into an excel file, assigned each grade the appropriate weight (listed below) and I graphed out my findings. Some more detailed procedures are below.
Here were the qualifier weights I chose to use. This will help account for issues that are generally off-centered. They are the same that PSA uses in their Set Registry:
9Q = -2
8Q = -2
7Q = -2
6Q = -2
5Q = -2
4Q = -2
3Q = -1
2Q = -1
1Q & 1.5Q = no deduction
I chose to exclude PSA Authentic cards from the data to eliminate any altered or autographed cards.
My findings: (Sorry the graph title was lost when I transferred it to JPG)
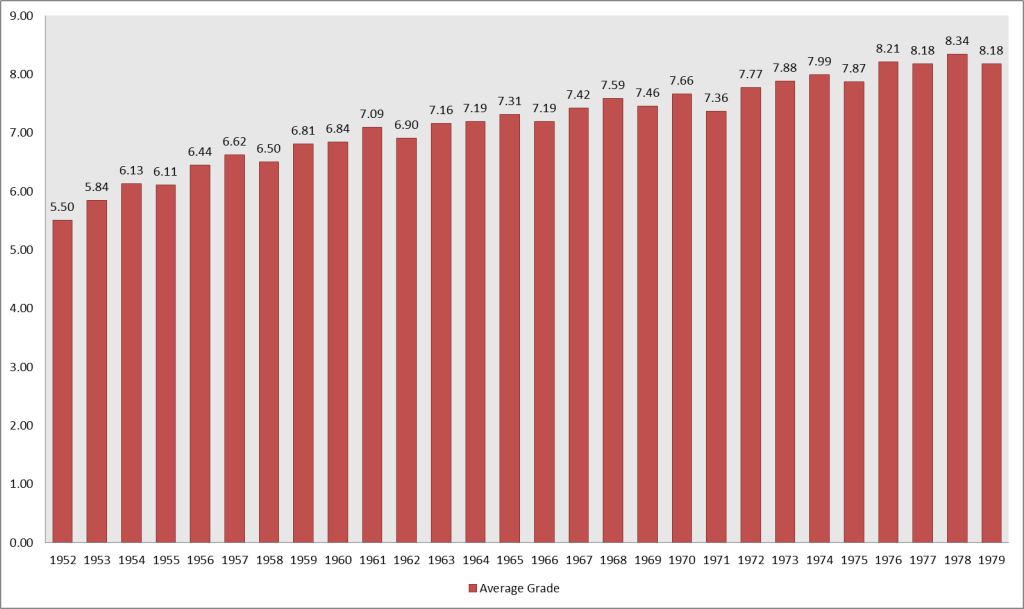
Some interesting findings:
It appears some of the relatively tougher sets would be: 1955, 1958, 1962, 1966, 1971, 1975
1962, 1971 and 1975 are understandable because of their colored borders, but what about the other three?
Some of the easier sets: 1961, 1965, 1968 and 1976
An interesting thought: I personally consider 1975/76 to be the cutoff between vintage and modern (mainly because I'm a 1975 Topps guy). Would it be fair to say that an appropriate measure to differentiate vintage and modern is an average grade of NM-MT?
Food for thought, happy Monday!!
Here were the qualifier weights I chose to use. This will help account for issues that are generally off-centered. They are the same that PSA uses in their Set Registry:
9Q = -2
8Q = -2
7Q = -2
6Q = -2
5Q = -2
4Q = -2
3Q = -1
2Q = -1
1Q & 1.5Q = no deduction
I chose to exclude PSA Authentic cards from the data to eliminate any altered or autographed cards.
My findings: (Sorry the graph title was lost when I transferred it to JPG)
Some interesting findings:
It appears some of the relatively tougher sets would be: 1955, 1958, 1962, 1966, 1971, 1975
1962, 1971 and 1975 are understandable because of their colored borders, but what about the other three?
Some of the easier sets: 1961, 1965, 1968 and 1976
An interesting thought: I personally consider 1975/76 to be the cutoff between vintage and modern (mainly because I'm a 1975 Topps guy). Would it be fair to say that an appropriate measure to differentiate vintage and modern is an average grade of NM-MT?
Food for thought, happy Monday!!
My eBay Store ")
"Be who you are and say what you feel, because those who mind don't matter and those who matter don't mind." Dr. Seuss
"Be who you are and say what you feel, because those who mind don't matter and those who matter don't mind." Dr. Seuss
0
Comments
interesting chart, seems about what would be expected, but it's always better seeing it in a visual.
Always looking for Topps Salesman Samples, pre '51 unopened packs, E90-2, E91a, N690 Kalamazoo Bats, and T204 Square Frame Ramly's
Would like to see an average price per set to compare the average value vs the average grade.
<< <i>Considering how popular 1978 is ... and how difficult 1979 is ... care to update your graph to include those 2 years?
Done
"Be who you are and say what you feel, because those who mind don't matter and those who matter don't mind." Dr. Seuss
I used 1953 Bowman Color for popularities sake, no wonder it gets such a premium!
Another interesting finding; 1975 Topps mini's average grade is 7.85, only .02 points lower than that of the regular issue. I personally was always under the impression that the minis were a much harder issue to find in high grade.
"Be who you are and say what you feel, because those who mind don't matter and those who matter don't mind." Dr. Seuss
<< <i>The 1961 set has like 5 or 6 Mantles which may be another reason why it appears to be a more condition sensitive set than it really is. >>
That's a terrific point! I redid the calculations for 1961 Topps WITHOUT the 5 Mantles I found (#300, 307, 406, 475 and 578) and it came out to 7.15! A full .06 point higher than with the Mantles. It would be interesting to see how high numbers effect grades. (particularly 1952)
Some interesting statistics about Mickey Mantle and the 1961 Topps pop report:
Mickey Mantle cards (#300, 307, 406, 475 and 578) account for 36.5% of the 1's in the pop report, 30.1% of the 2's, 23% of the 3's, 19.5% of the 4's, 13% of the 5's, 10% of the 6's and only 2% of the 8's.
I think it's clear that star power weighs a set down.
"Be who you are and say what you feel, because those who mind don't matter and those who matter don't mind." Dr. Seuss
..
2Q = -1
1Q & 1.5Q = no deduction
...
This would mean that a 1.5Q card actually gets a higher ranking on PSA than a 2Q card. I would think a 1.5Q needs a .5 deduction.
Lou Gehrig Master Set
Non-Registry Collection
Game Used Cards Collection
Bosox1976