Does the price of gold mirror our national debt
 HalfDime
Posts: 654 ✭✭✭✭
HalfDime
Posts: 654 ✭✭✭✭
The price of gold and the U.S. national debt have shown a notable long-term relationship, but they do not move in perfect lockstep. Instead, gold prices generally trend upward as the national debt increases, though the correlation is influenced by multiple other economic and geopolitical factors.
Gold is widely regarded as a hedge against economic uncertainty and inflation, both of which can be exacerbated by rising national debt.
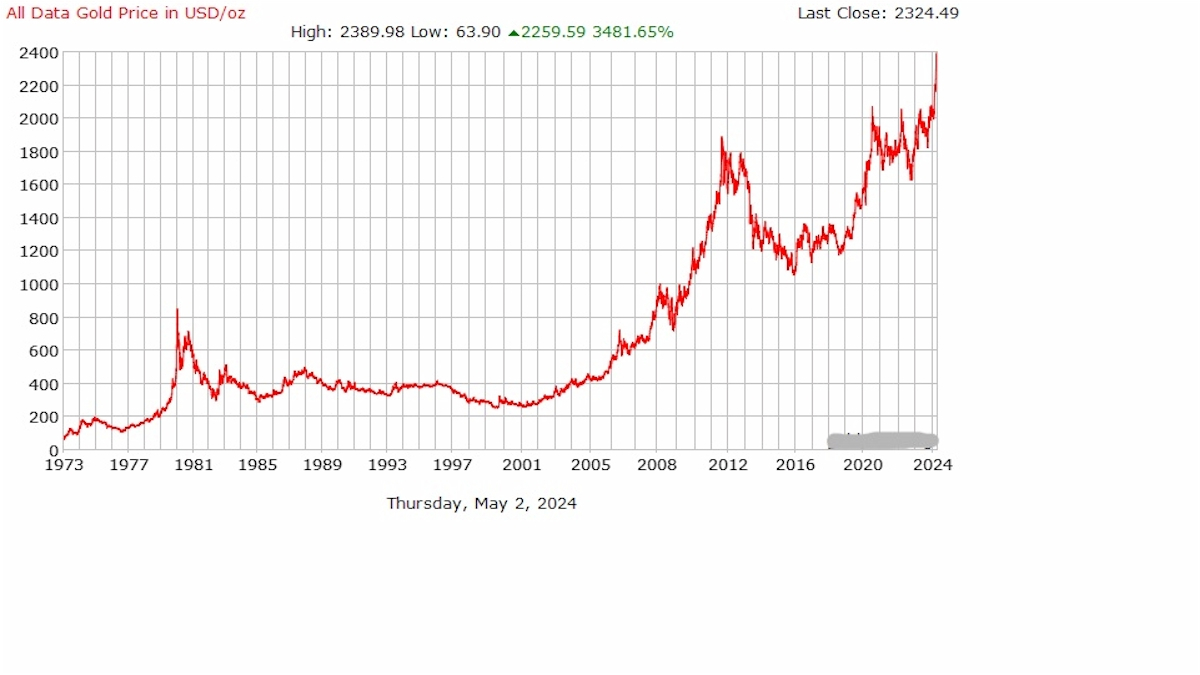
Historical data shows that as U.S. government debt has grown—from about $370 billion in 1970 to over $31 trillion in 2023—gold prices have also increased, from $35 per ounce in 1970 to nearly $2,000 per ounce in 2023.
The general trend line for gold prices has mirrored the rise in national debt, with some analysts noting that gold has increased by roughly $1,000 for every $15 trillion in additional debt over recent decades. However, gold prices are not solely determined by national debt. Other factors such as market sentiment, central bank policies, real interest rates, geopolitical tensions, and currency fluctuations play significant roles in gold’s valuation.
Statistical analysis confirms a strong correlation between gold prices and the size of U.S. federal debt, but not a direct one-to-one mirroring.
The value of U.S. gold reserves is now a very small fraction of total debt—about 2% as of early 2025, compared to 40% during World War II—highlighting how much faster debt has grown relative to gold holdings and prices. While the upward trajectory is clear, there are periods where gold prices diverge from debt trends due to external shocks or shifts in investor behavior. Some analysts suggest that, based on historical ratios, gold could be undervalued relative to current debt levels, implying potential for further price increases if debt continues to rise.
Year U.S. Debt Gold Price
1970 372,007 35
1980 863,451 653
1990 3,051,958 415
2000 5,773,392 283
2010 12,773,123 1,078
2020 23,223,813 1,584
2023 31,457,820 1,982
The price of gold tends to rise alongside the U.S. national debt, reflecting gold’s role as a hedge against fiscal instability and inflation. However, the relationship is not perfectly mirrored; gold’s price is also shaped by a range of other economic and geopolitical factors. While the long-term trend is clear, short-term fluctuations and divergences are common, so gold and national debt should not be viewed as moving in exact tandem.
......................................
25 years ago the national debt was only about 6 trillion dollars, and since then we have added another thirty trillion dollars in debt. This is coincidentally when gold really started its upward trajectory.
Comments
You stated a lot of interesting facts.
It's always been impossible to predict herd mentality, which seems to be going on with gold right now. That being said, there are a number of world events brewing that if coming to fruition, I think could crater the price of gold at least to some degree.
We shall see which way the herd will go. Stampede off a cliff or back to the water hole for some rest and relaxation.
You could substitute the words "stock market" or "real estate" in place of "gold" and the story would read the same.
Knowledge is the enemy of fear
It's always been impossible to predict herd mentality, which seems to be going on with gold right now.
It's been the central bank herd, and that's not likely to change any time soon.
I knew it would happen.
Here is a graph based on your data with today's numbers added. Gold is orange data.
My US Mint Commemorative Medal Set